tiny-riscv: A small RV32E CPU
tiny-riscv is (true to its uninspired name) an attempt to build the smallest RISC-V core possible while maintaing roughly one Instruction per Cycle. It achieves this by supporting the base RV32E instruction set with a simple two stage pipeline. The implementation targets the FreePDK45nm standard cell library.
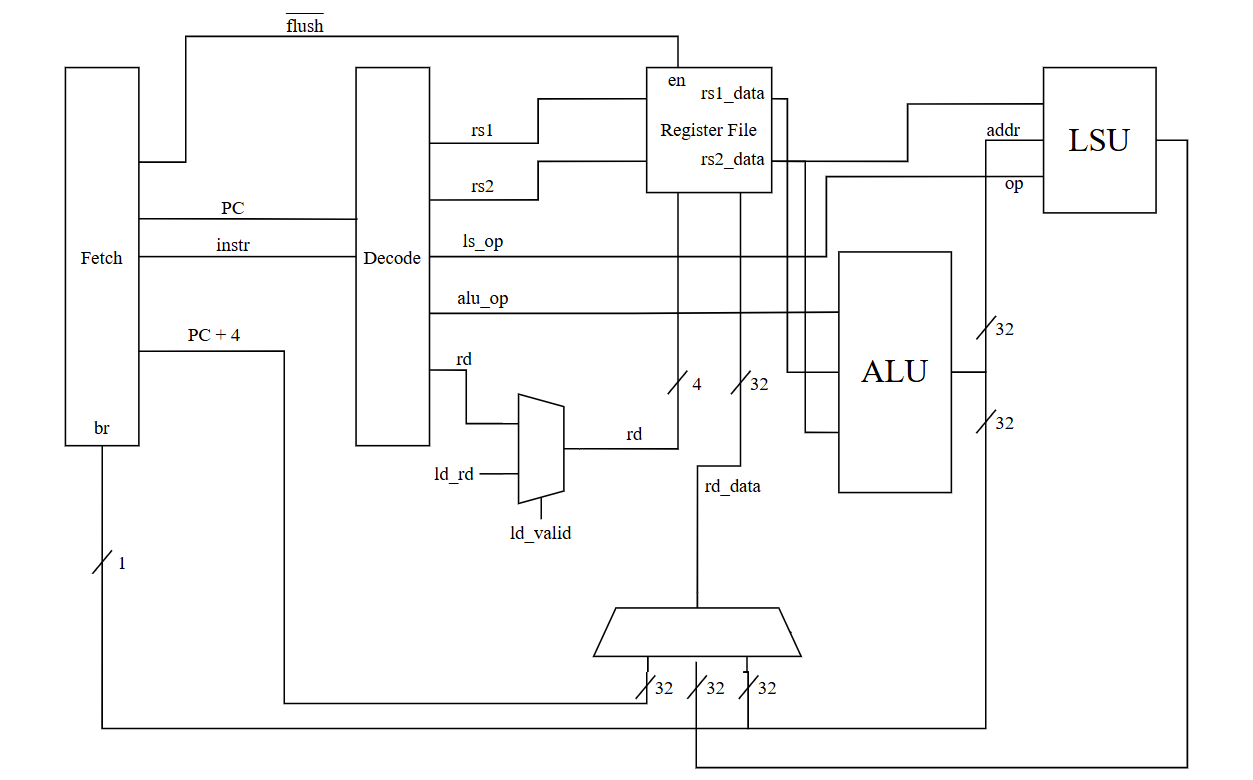 A very simplified diagram of the core pipeline
The RTL for the core, along with various other artifacts, can be found on GitHub:
Architectural Overview
The microarchitecture is intentionally lean to keep the gate count down. To maximize simplicity, I chose to implement only two cycle pipeline:
- Instruction Fetch: A dedicated ripple-carry adder calculates the next PC so fetching can happen alongside execution.
- Execute: A combined stage that handles Decode, ALU operations, Memory access, and Writeback.
Cramming decode, execute, LS, and writeback all in one stage limited Fmax considerably. Fortunately for me, I was never really worried about the frequency.
To save area, the ALU uses a few "cheap" hardware tricks. For example, instead of a dedicated comparator, it reuses the ripple-carry adder to perform subtractions for comparisons. It also uses a single barrel shifter for both directions by reversing the operand before and after a right shift.
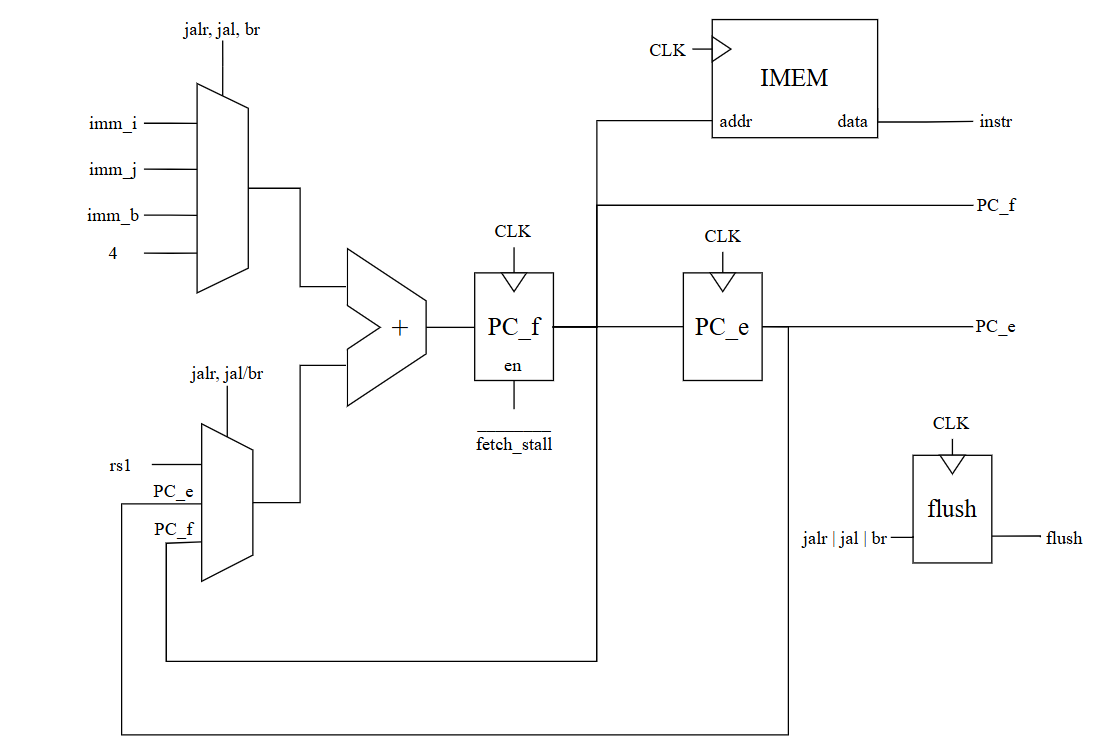
A diagram of the fetch unit.
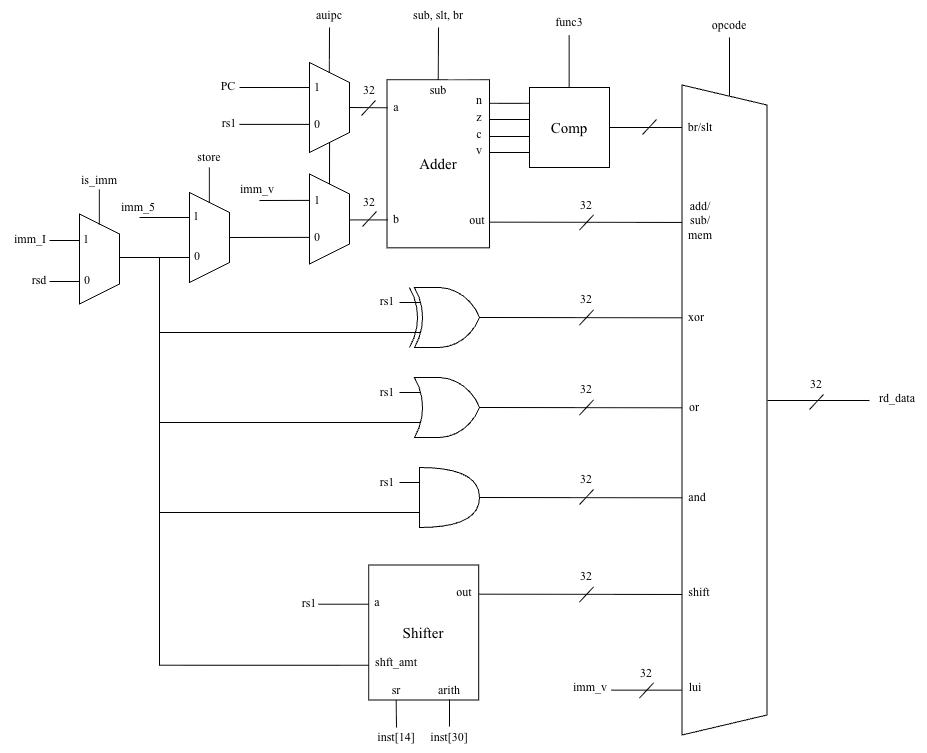
A diagram of the ALU.
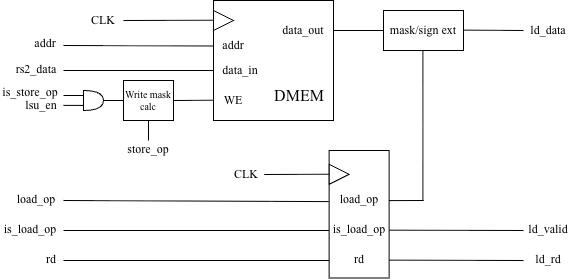
A diagram of the load/store unit.
Results and Comparison to SERV
In my mind, the main competitor to tiny-riscv is SERV which claims to be "the world's smallest RISC-V CPU". While I'm not sure if that claim is accurate, it is definitely smaller than what I managed to do with tiny-riscv. The issue with SERV is that due to its serialized nature, it isn't a very performant design. However considering the very high clock speeds it can achieve, perhaps it is intended to serve (ha!) a different niche.
Finding and comparing area
I ran the RTL of both my design and SERV through Synthesis (Yosys) and Automatic Place and Route (Cadence Innovus) targeting the FreePDK45nm standard cell library and measured the results. Although results generated with this SCL may not be extremely realistic, they are useful as a rough comparison.
It should be noted that the results for each design exclude the register file. It turns out that a 1K SRAM generated using gates from a FreePDK45nm is very large. I don't have access to any SRAM macros, but it wouldn't meaningfully contribute to these results anyway.
Area Results:
| Design | Post-synthesis | Post-APR | NAND2 Gate Equivalent |
|---|---|---|---|
| tiny-riscv | 5373.9543 µm² | 5166.0544 µm² | 2752 GE |
| SERV | 2658.5845 µm² | 2387.7984 µm² | 1272 GE |
Tiny-riscv is ~2.2x larger than SERV.
Since I had this diagram already prepared, here is the area breakdown by unit:

Breakdown of the major core components based on estimated silicon area.
The unlabeled portion of the Fetch unit area is dominated by the PC register.
The unlabeled portion of the ALU is dominated by the large function selection MUX.
Estimating Maximum Frequency
Static timing analysis was performed with Synopsis Primetime using the netlist generated by Yosys and the parasitics extracted from the post-PnR model generated by Innovus.
Critical Path (Fmax) Results:
| Design | Pre-APR | Post-APR | Fmax |
|---|---|---|---|
| tiny-riscv | 2.4748 ns | 2.5097 ns | 398.5 MHz |
| SERV | 0.7163 ns | 0.7377 ns | 1355 MHz |
The maximum frequency of tiny-riscv is ~3.4x lower than SERV
From these results, tiny-riscv seems pretty terrible. That is until you run some benchmarks.
Calculating IPC
To estimate performance I ran a suite of UC Berkeley benchmarks through the Spike ISA simulator to calculate the instruction mix for each workload. I then multiplied these frequencies by the cycle cost for each instruction type to calculate the total number of cycles each application required for each core.
Due to the simplicity of both CPUs (i.e. no branch predictors or caches), performance should be realtively deterministic. I am confident that this method produces a useful performance comparison for the two cores. Ideally, I would drop SERV into my RTL simulator and produce real like-for-like IPC values, but this rough estimation is all I had time for.
Here are the results:
| Design | IPC | Fmax | Normalized Perf |
|---|---|---|---|
| tiny-riscv | 0.8355 | 398.5 MHz | 332.9 MIPS |
| SERV | 0.0261 | 1355 MHz | 35.37 MIPS |
And an explanation:
- tiny-riscv: Most instructions execute in a single cycle. Stalls only occur on taken branches or load instructions. This results in a solid average of 0.8355 IPC.
- SERV: Because it processes data one bit at a time, it takes many cycles to complete a single instruction. On the same benchmarks, it averaged roughly 0.026 IPC
Here is the list of benchmarks and exact IPC values for tiny-riscv:
| Test | Description | Instructions | Cycles | IPC |
|---|---|---|---|---|
| aes.c | Basic AES128 implementation | 33,322 | 41,052 | 0.8117 |
| multiply.c | Software based multiply | 27,020 | 30,472 | 0.8867 |
| quick sort.c | Quick sort algorithm | 134,481 | 185,949 | 0.7232 |
| radix sort.c | Radix sort algorithm | 182,404 | 216,197 | 0.8437 |
| sha256.c | SHA256 algorithm | 43,085 | 47,134 | 0.9141 |
| towers_of_hanoi.c | Towers of Hanoi puzzle | 3,726 | 4,469 | 0.8337 |
| Average | 0.8355 |
In conclusion, tiny-riscv acheives ~9.4x higher performance while consuming ~2.2x more silicon area when compared to SERV. Is this a good tradeoff? IDK.